(Istituto Universitario Salesiano de Venezia, Italia) – How can we make a complex social phenomenon like educational poverty understandable? How can we transform data, indicators, and research frameworks into visual forms that can speak not only to specialists but also to the broader community?
These are some of the questions that guided the Information Design and Data Visualization workshop of the third year of the three-year degree course in Digital & Graphic Design at the IUSVE Faculty of Communication, Venice campus, in the 2025-2026 academic year.
The workshop, an integral part of the course, includes 32 hours dedicated to developing a real project for a real client. This is the context for the collaboration initiated with ISTAT – National Institute of Statistics (ISTAT ), which began in 2024 as part of a shared program between the Institute and IUSVE, structured into four workshops in the 2024-2025 and 2025-2026 academic years.
The collaboration is part of the innovation objective ” Promoting statistical culture among younger generations ,” defined by ISTAT in the PIAO 2022-2024, with the aim of involving students in the creation of graphic representations of complex social phenomena. The proposed themes were educational poverty and equitable and sustainable well-being .
In the case of the workshops held in Venice, the objective indicated by ISTAT was to explore new visual ways to represent the framework for measuring educational poverty , developed by the Interinstitutional Scientific Commission established by ISTAT in 2023.
It is a complex system of domains, dimensions, sub-dimensions, and indicators, designed to measure and monitor, over time and space, the progress and impact of policies implemented locally to address inequalities in resources and outcomes. This is a complex design challenge, precisely because of the multidimensional nature of the phenomenon and the intertwining of data, social contexts, living conditions, and educational opportunities.
Approximately 100 third-year students from the Department of Design and Development (DGD) in Venice worked on this challenge , divided into project teams. The process included an initial meeting with ISTAT researchers to present the topic and data; a phase of independent planning for the groups, supervised by Professor Ugo Guidolin ; and a final feedback meeting, during which the teams presented their work to ISTAT representatives.
The students were asked to develop a graphic concept capable of translating complex information into clear, accessible, and communicatively effective forms. The final result required a video graphic capable of visually reworking the framework, respecting its structure in domains, dimensions, and sub-dimensions.
The work wasn’t limited to data visualization. It required a deeper reflection on how design can contribute to public understanding of a social problem. Educational poverty, in fact, isn’t just about schools or access to education, but the entire range of opportunities that allow children and adolescents to grow, express themselves, participate, and build their own future.
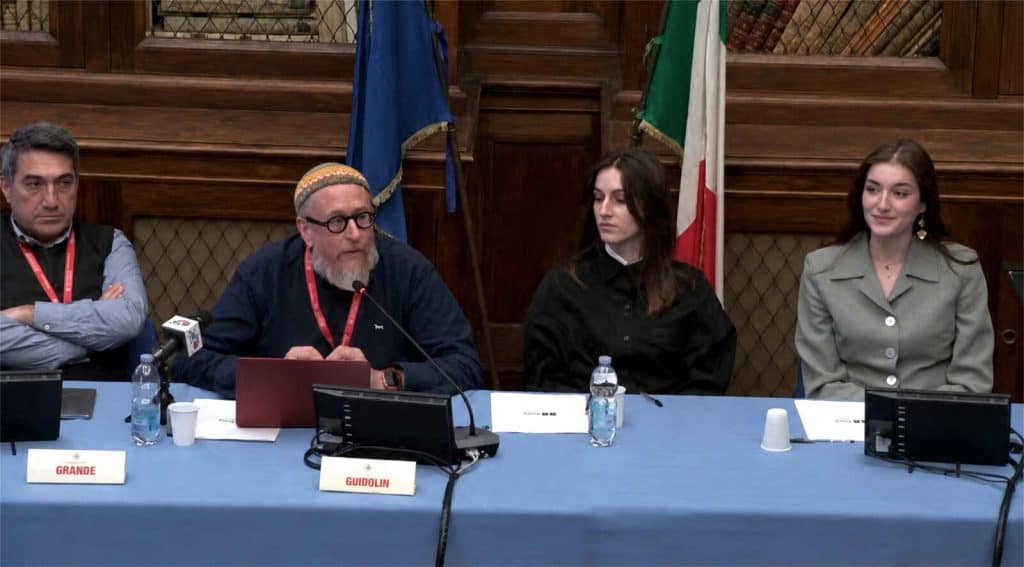
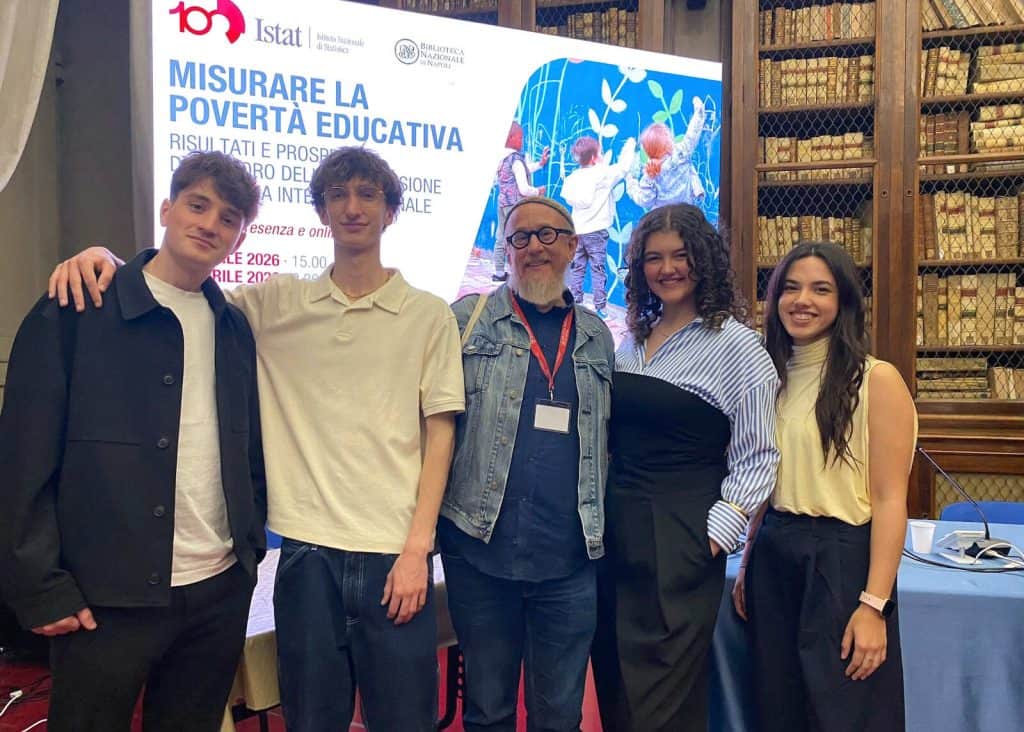
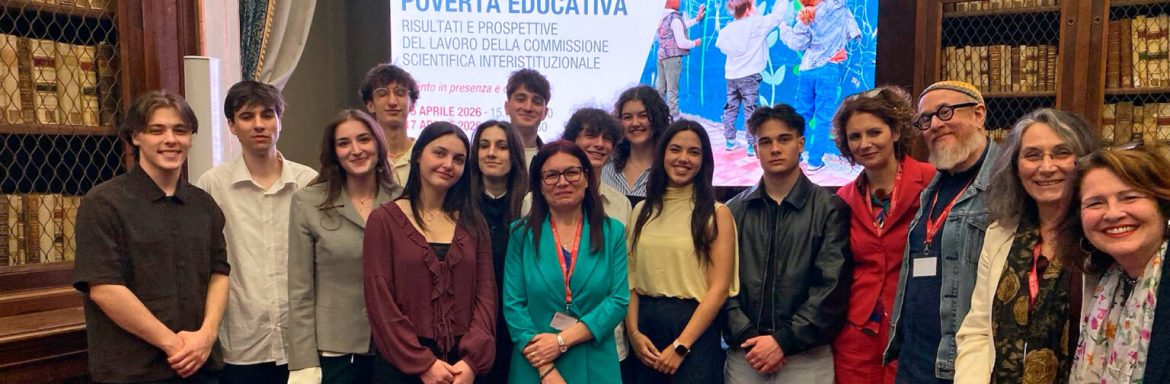
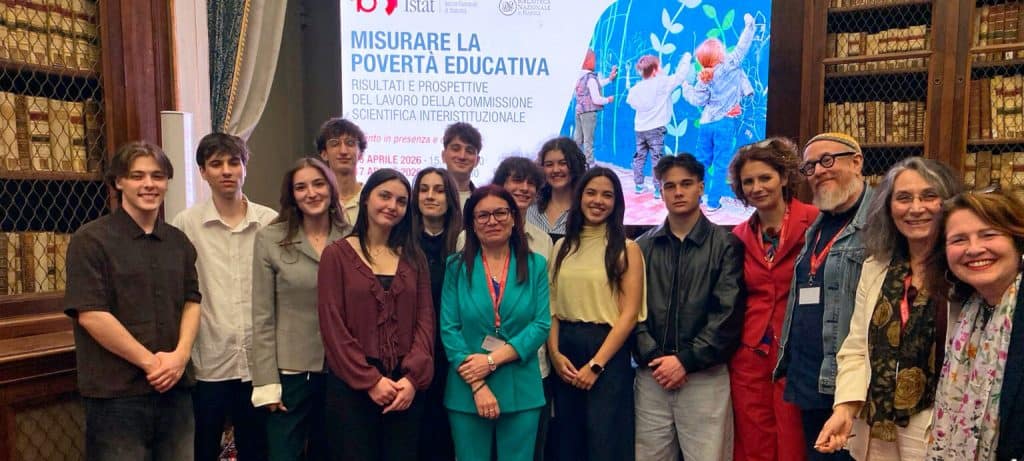
A particularly significant moment in the process was the invitation from ISTAT to participate in the National Conference on Educational Poverty , held in Naples on 16 and 17 April 2026. At that conference, the results and work perspectives of the Interinstitutional Scientific Commission on Educational Poverty , established in 2023 by ISTAT with the involvement of the scientific community, civil society, government officials and institutions, were presented and shared.
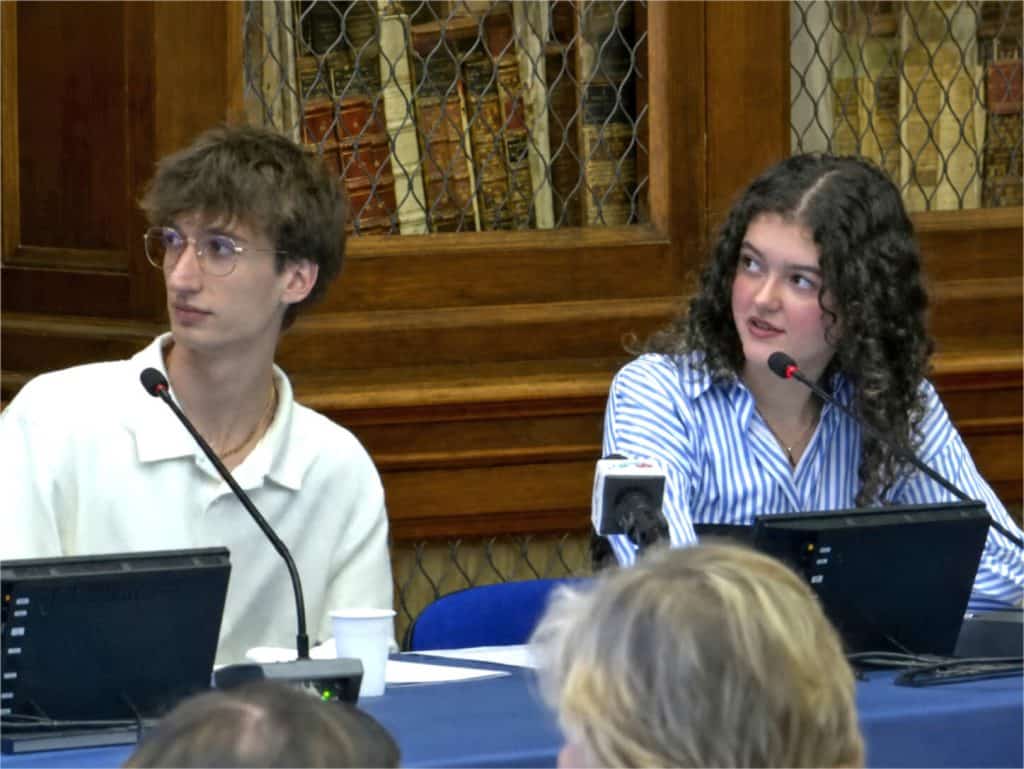
The conference was attended by Professor Ugo Guidolin and eleven students from the DGD laboratory in Venice. The students had the opportunity to present their projects in the session ” Every Child Has the Right to Shine ,” a title taken from one of the projects created during the workshop.
It was an intense and profoundly formative experience. The students chose to travel to Naples at their own expense to attend the meeting, bringing with them not only the project results but also the knowledge that they had worked on a topic of great civic relevance. The interaction with the ISTAT audience and the feedback received reaffirmed the group’s appreciation of the concrete value of the work they had undertaken.
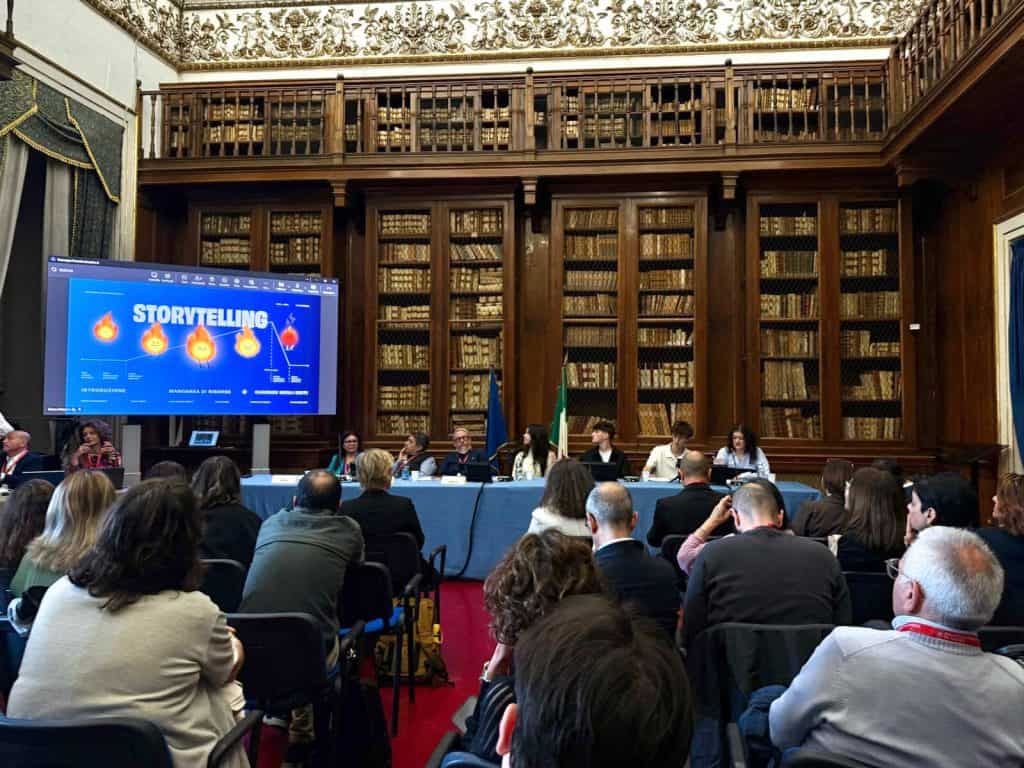
In his speech at the conference, entitled “Telling a Complex Phenomenon: Video Graphics as a Bridge of Understanding for Everyone,” Professor Guidolin reflected on the role that information design, instructional design, and storytelling can play today in communicating complexity. In an era where data is increasingly present in public discourse, designing effective visualizations isn’t just about “prettifying” numbers, but also about building bridges of understanding between research, institutions, and the public.
The video graphics published below represent the results of the DGD Venice workshop, third year, academic year 2025-2026. These projects differ in language, style, and narrative approach, but they share a common goal: to make visible what often remains abstract, to give form and voice to a phenomenon that concerns the real conditions of growth of new generations.
Sincere thanks go first of all to all the students who participated with enthusiasm, sensitivity and responsibility in the Information Design and digital visualization workshops .
Special thanks go to Dr. Miria Savioli , Department of Social and Demographic Statistics, who welcomed and supported the students and their projects with great care and empathy. We also thank for their availability and collaboration: Barbara Baldazzi , Department of Economic and Environmental Statistics, Patrizia Collesi , Central Directorate for Communication, Information and Services to Citizens and Users, Daria Squillante , Department of Social and Demographic Statistics, Roberto Costa , Central Directorate for Communication, Information and Services to Citizens and Users.
The following projects demonstrate how design, when it encounters data and social issues, can become a tool for knowledge, participation and care.